5+ Best WordPress Themes for Non-Profit, Charity and Fundraising Organizations
July 14, 2019Cleaning company wordpress theme for service business
July 31, 2019CSS jQuery Graph Bar, Pie Chart and other chart
Now days pie chart ,grant chart and many others chart are needed to visualize the business data in web based software. These charts are purely developed in jquery,html5,css3. Anyone whom have the idea of code they can easily integrate charts into their code. Each of the chart is very powerful chart . This chart is interactive and attractive . We are sharing enormous of chart . You will get your favorites one .Make business presentable with these. Business will talk with this chart.
Visualizing a CSV file with Chart.js

This a horizontal html graph. In this graph we see lots of horizontal line in different colors. There are different names of girls and boys. This chart is totally free. What you need just copy and paste the code and pass the data form database.
DOWNLOADGantt chart

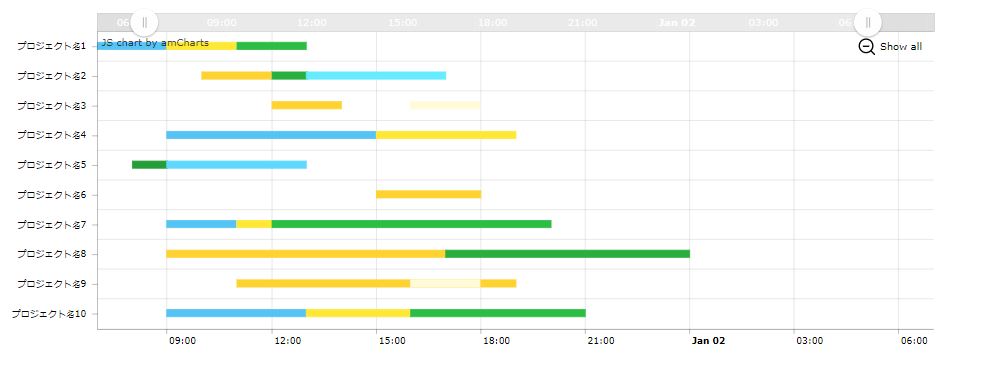
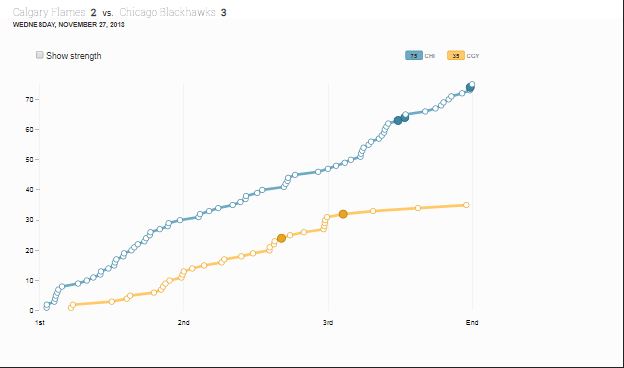
This is a chart that depict project schedule .It’s shows duration of each activity. This one is multi color chart for project ,business, cms and ecommerce dashboard .
DOWNLOADMultiline Chart
This one is a great chart. Narrow shape line makes it more lucrative and attractive.
DOWNLOADBar animated chart
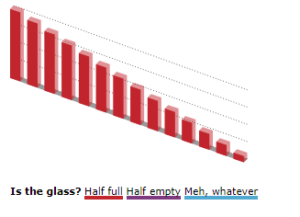
This is a colorful bar chart where you can show your data details in different color.
DOWNLOADGroup bar chart
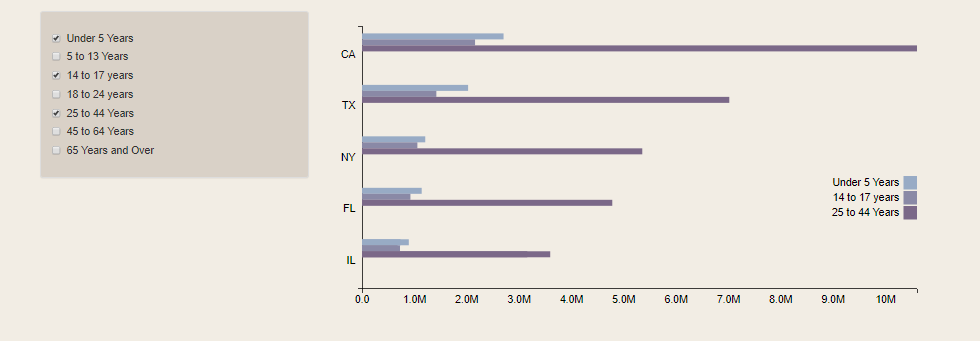
Very intelligent chart that has been developed . When you check the checkbox then data will show.
DOWNLOADMulti color Bar Chart

If your main motto is to represent colorful bar chart.
DOWNLOADComparative Bar chart
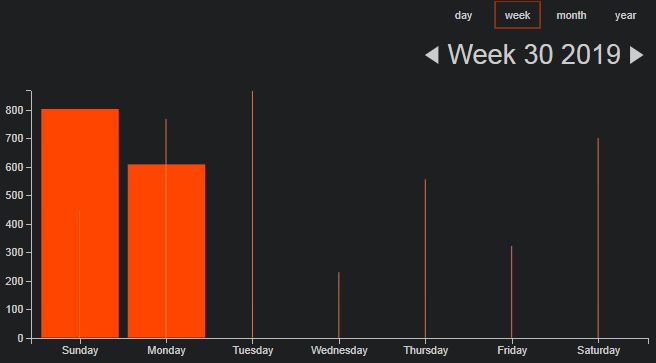
This bar chart come up with calendar where you can filter the data visualization day ,month and year ways.
DOWNLOADRainbow bar chart
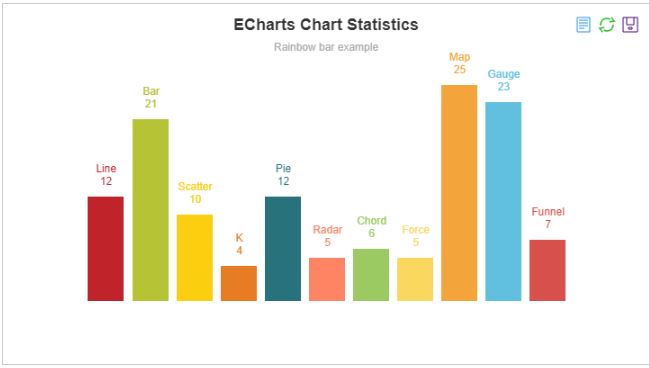
You can save the bar chart status and reload data whenever you want to do.
DOWNLOADBeautiful wall bar chart

That sequentially update and its looks like hill or wall. Date ways graph in the chart.
DOWNLOADDual line & bar chart

Nice dual line bar chart that makes your chart more visual.
DOWNLOADBubble-Bar chart – Crossfilter
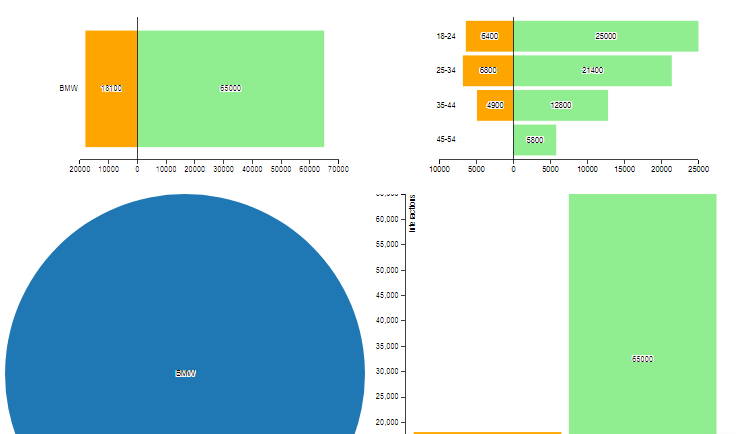
Simple most amazing chart. They are green and orange color. There are many different chart available.
DOWNLOADHighcharts Sample
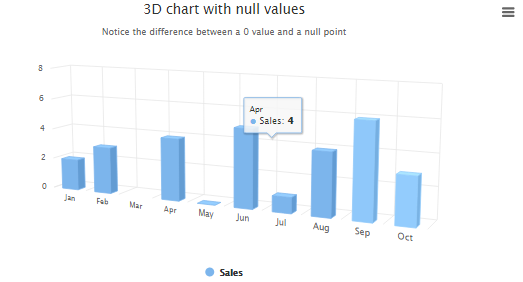
3D chart with nice blue bar graph. In the graph every month total information show.
DOWNLOADPyramid 3D
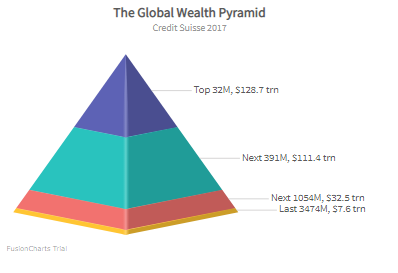
You will understand by the name of it. This graph show the data in pyramid view. When you take the mouse over on it will show the information color ways.
DOWNLOADPlotly.js 3D charts
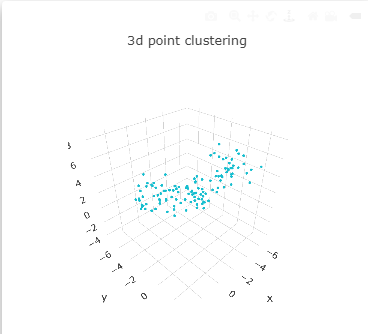
Plotly is a name to understand the product. This type of graph use for scientific research. There are three axis.
DOWNLOADSeries chart

Nice 3D chart from fusion chart. They are in a row.
DOWNLOADStacked bar chart

Multiple data in a same row . In this graph three names people eat food in several amount.
DOWNLOAD3D Funnel chart
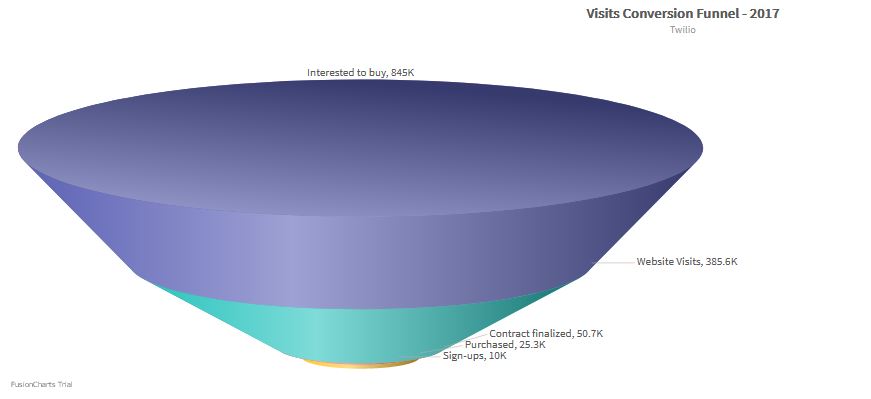
Funnel chart is looks like a funnel .Its use in many international company.
DOWNLOADPie in 3D

This is most famous pie chart . When click the portion of pie chart its just pop up.
DOWNLOADHill 3D chart
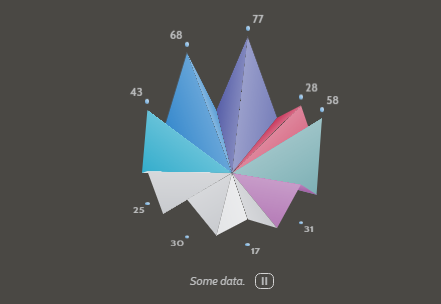
This chart only show specific hill. All the info different hill soar.
DOWNLOADChart gallery
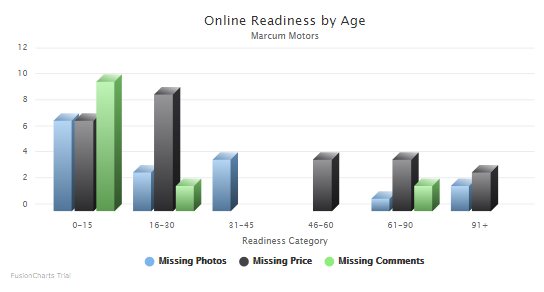
Bar in 3D

Column in 3D : Chart Gallery

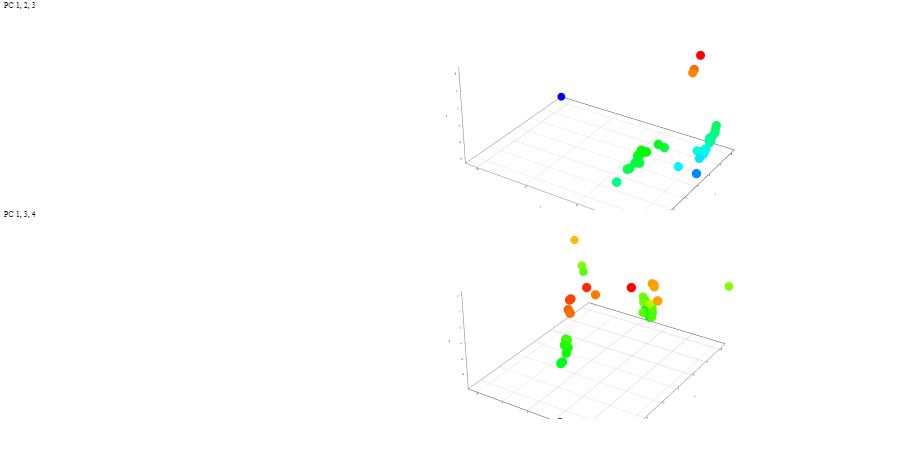
3d charts trial
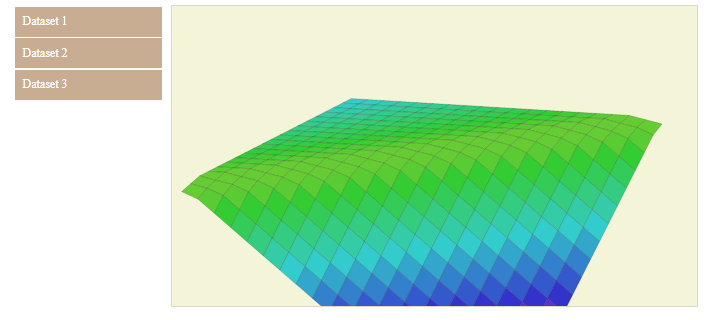
Responsive d3 chart inside a Bootstrap layout
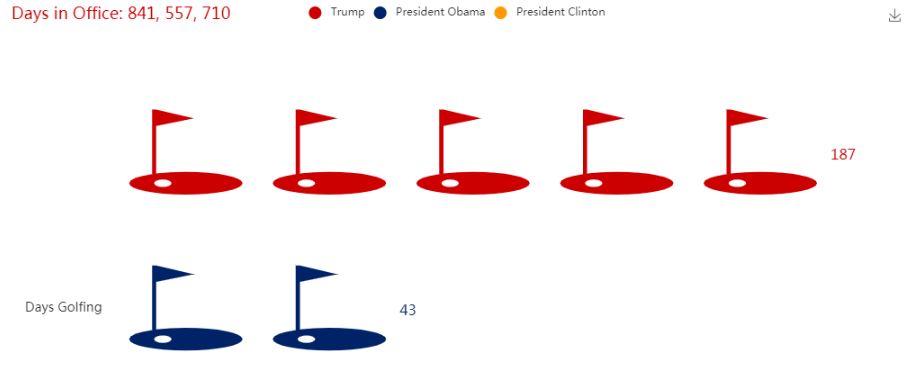
Trump Golf Outings
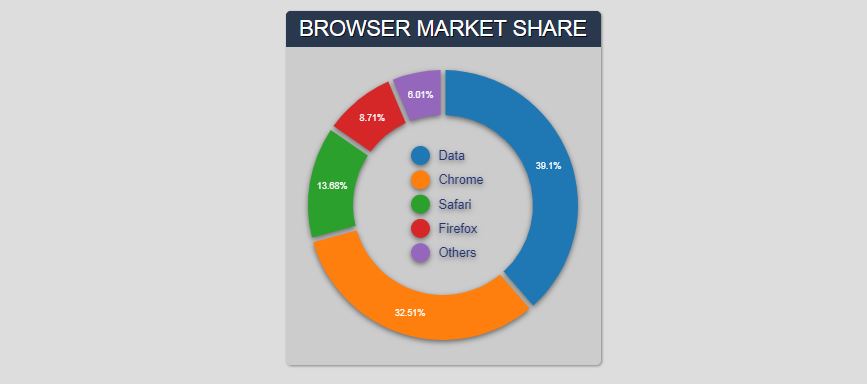
Circle Chart
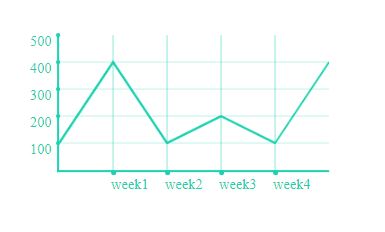
Pure Canvas Line Chart
Trading view btc chart
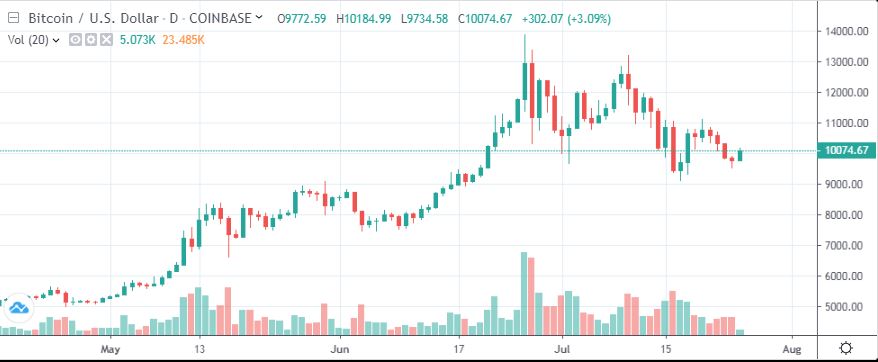
Analytics Chart

line chart
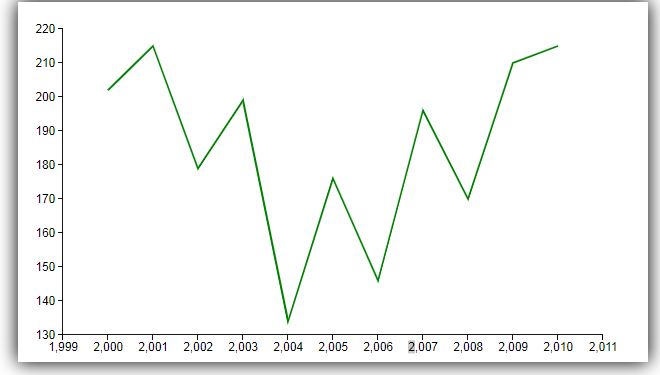
Example Chart Colors

Gantt chart
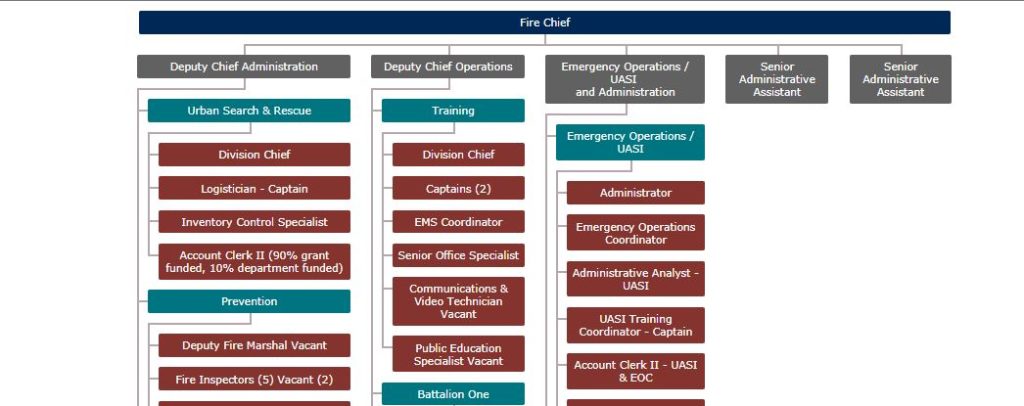
Organ gram chart
3D Chart
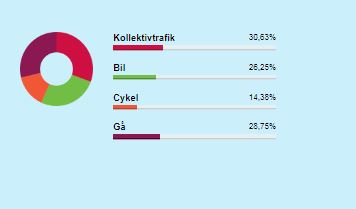
Doughnut chart with animation and tool tip

Radar Chart jQuery Plugin

D3 Line Chart Plotting
Canvas pie chart with CSS bar chart fallback
Animated chart with jQuery
Make Google Charts Responsive

Customisable Animated Donut Chart

Css3 Graphs

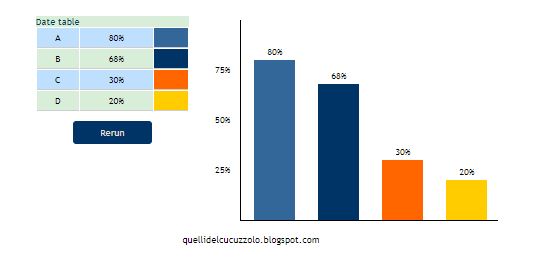
CSS3 Bar Graphs

